PM Dashboard
The PM Dashboard (My Dashboard in the nav) is your home page. It shows everything you've predicted, what you owe (overdue resolutions), and how well you've been calibrating.
At a glance
The page has six sections, top to bottom:
- Filter bar — slice the page by tag.
- Stats hero — your headline calibration numbers.
- Awaiting Resolution + Accuracy by claim — what you owe, and where your thinking breaks.
- Drafts — hypotheses you started but haven't published yet.
- Active — published hypotheses still inside their review window.
- Resolved — closed hypotheses with their outcome.
1. Filter by tag
Every tag you've ever applied to a hypothesis shows up as a pill, with a count of matching hypotheses next to the name. Click a pill to filter every list on the page; click All to clear.
If you have more tags than fit on one row, the More N ▾ button at the end opens a popover with a search box and the full list — type to find a tag fast.

2. Stats hero
Three numbers that summarise how well your predictions match reality:
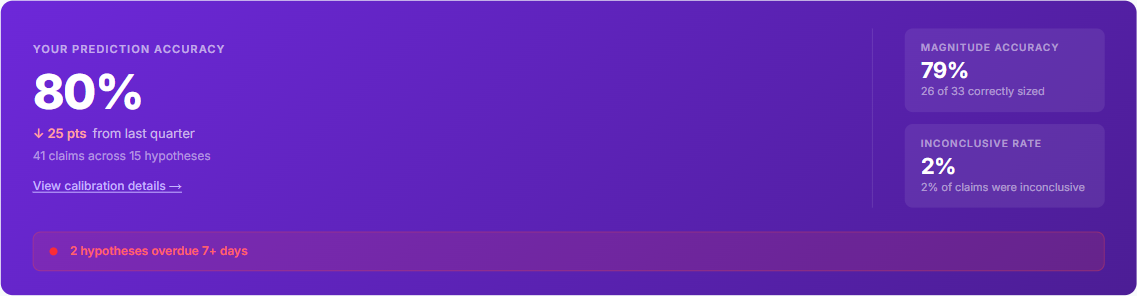
- Your prediction accuracy — the share of claims (not hypotheses) that resolved as predicted. The trend pill (e.g. ↓ 18 pts from last quarter) compares the current 90-day window with the previous one.
- Magnitude accuracy — of the claims you got right on direction, how many were also in the correct size band.
- Inconclusive rate — claims you couldn't resolve cleanly (data missing, confound too large).
A red overdue ribbon appears under the hero when any hypothesis is more than 7 days past its review date.
3. Awaiting Resolution and Accuracy by claim
Awaiting Resolution lists every hypothesis past its review date, oldest first. Click Review to jump straight into the resolve flow.
Accuracy by claim breaks your hit rate down by step in the causal chain. The pattern usually tells a story — most teams are best at predicting what they changed and worst at predicting business outcome. That gap is your homework.

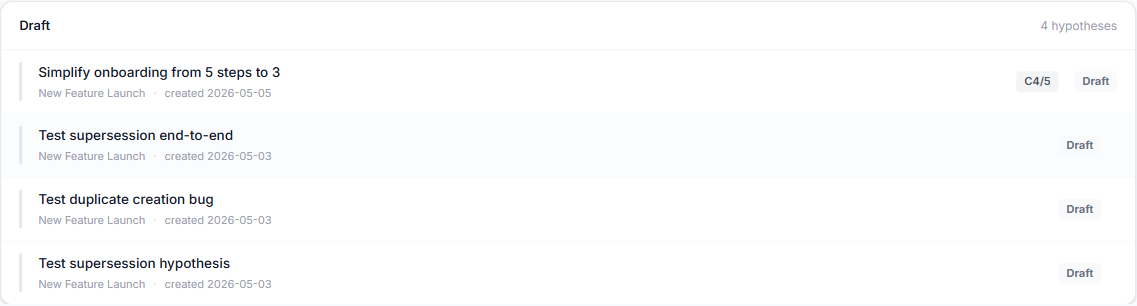
4. Drafts
Hypotheses that have been started but not yet published. They don't count toward calibration. Click any row to resume editing.
5. Active
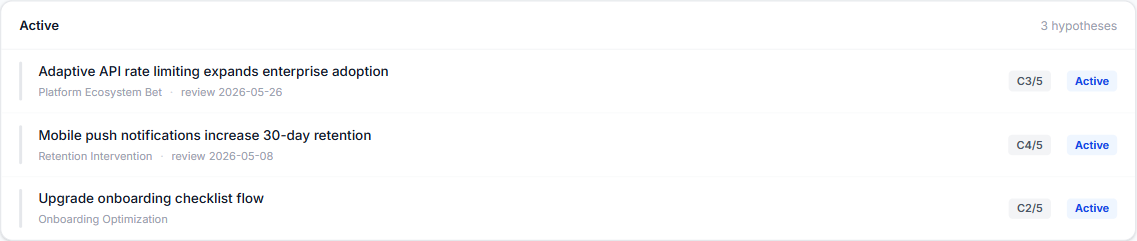
Published hypotheses that haven't been resolved yet. Each row shows the template, the review date, and your confidence (e.g. C4/5).
6. Resolved
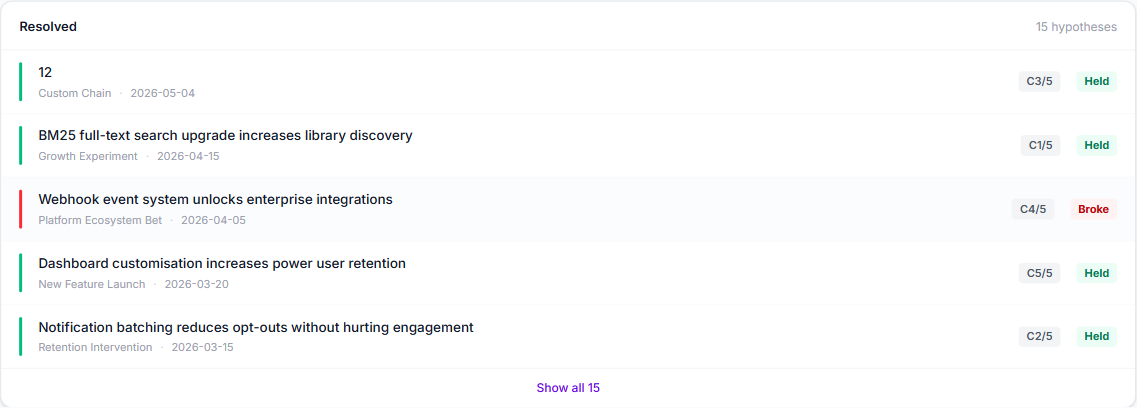
Closed hypotheses, newest first. The right-hand pill is the outcome:
- Held (green) — predictions matched reality.
- Broke (red) — predictions did not match.
- Inconclusive (grey) — the data wasn't usable.
The list paginates after 5; click Show all 15 (or however many you have) to expand it.
View options
The cog button at the top-right opens view options. Today there's one toggle: Show my private — fold your private hypotheses into the lists. Off by default so the dashboard reflects only what's visible to the team.

Next: The Calibration page →